
Performance Monitoring
ThirdEye performance monitoring gives operations teams a live view of network devices, servers, and supporting infrastructure, so they can spot slowdowns, outages, and capacity pressure before they turn into larger incidents.
Collected metrics become dashboards, graphs, gauges, thresholds, and alerts that make it easier to understand what is happening now and how infrastructure behavior is changing over time.
Performance Monitoring Capabilities
ThirdEye turns raw device and server metrics into operational views your team can act on. Use it to understand current health, investigate trends, and keep performance issues from hiding in noisy environments.
-
 Counters and metrics
Track utilization, availability, and other key counters from network devices, servers, and supporting systems in one monitoring workflow.
-
 Dashboards and graphs
Review live status and historical trends through dashboards and time-series graphs that help teams compare behavior across devices, interfaces, and time windows.
-
 Threshold awareness
Highlight values that need attention with compact gauges and threshold views while leaving room for the rest of your operational context.
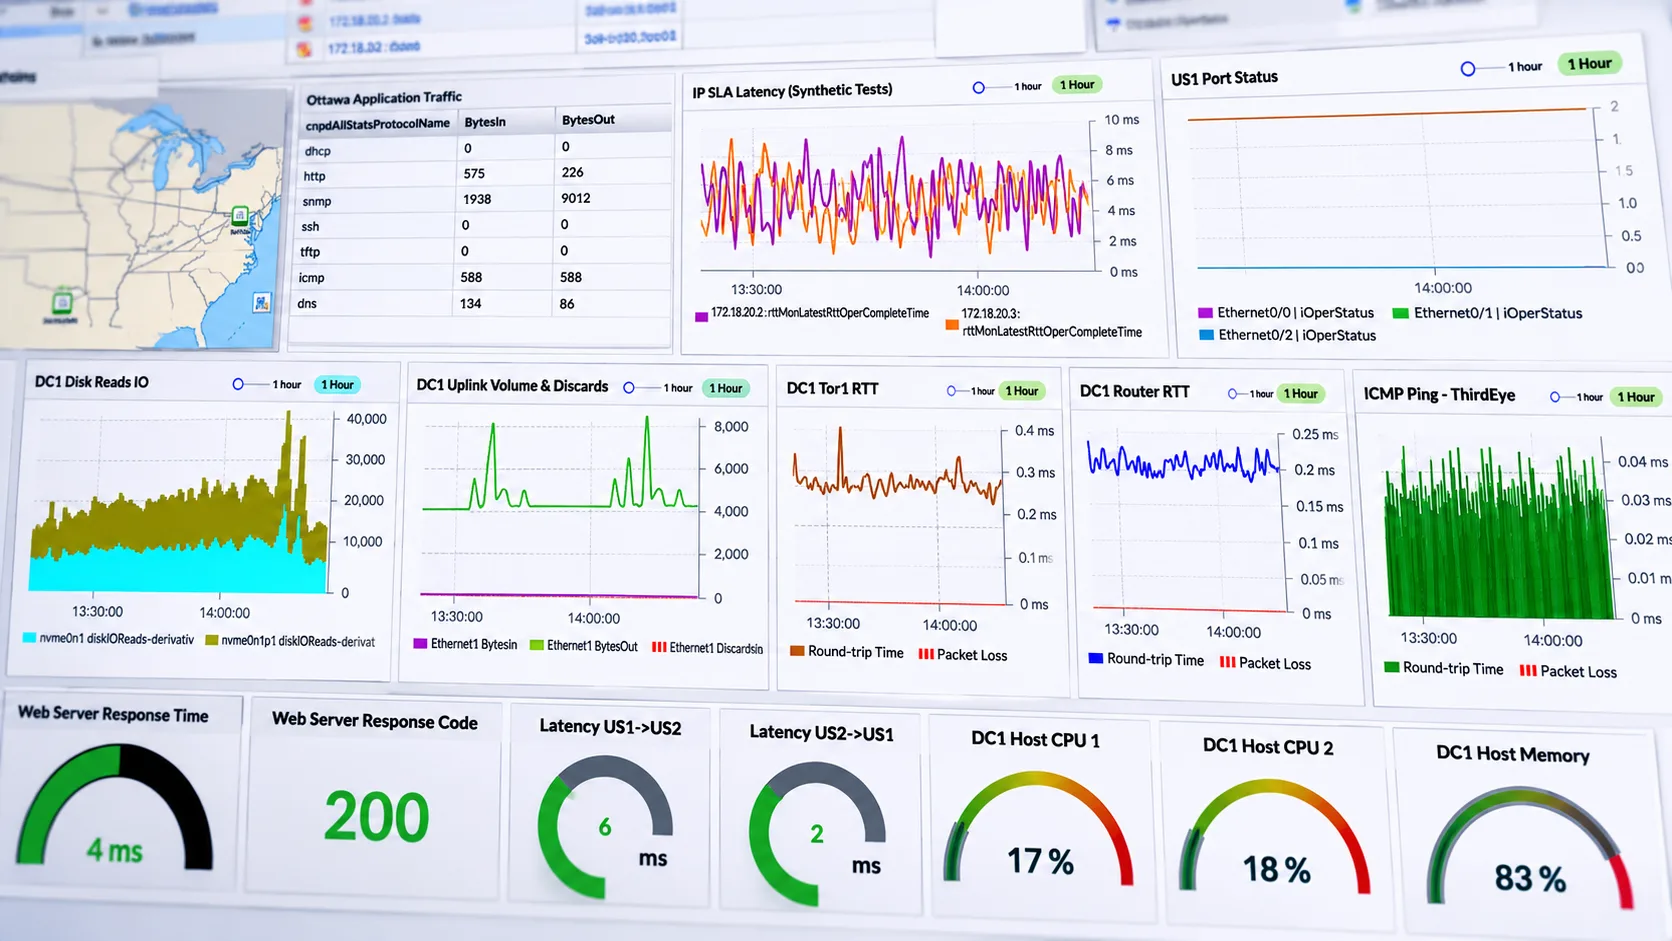
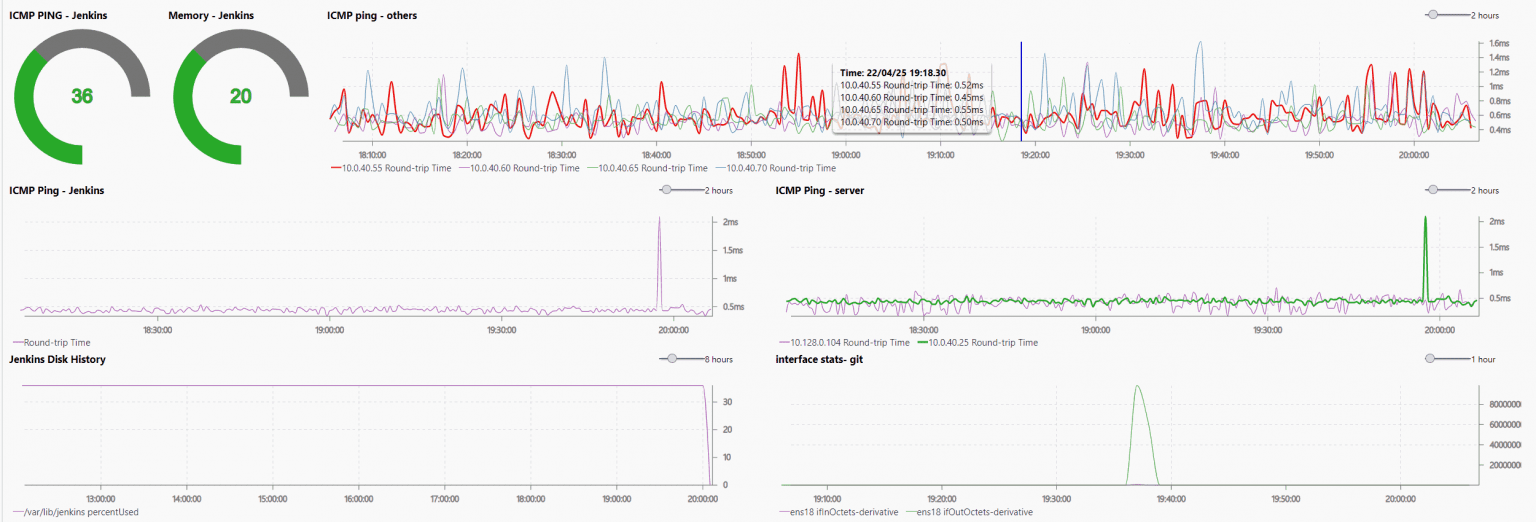
Dashboards and Graphs
Performance dashboards combine current-state widgets with historical graphs, giving teams a quick way to compare activity across interfaces, counters, devices, and time ranges.
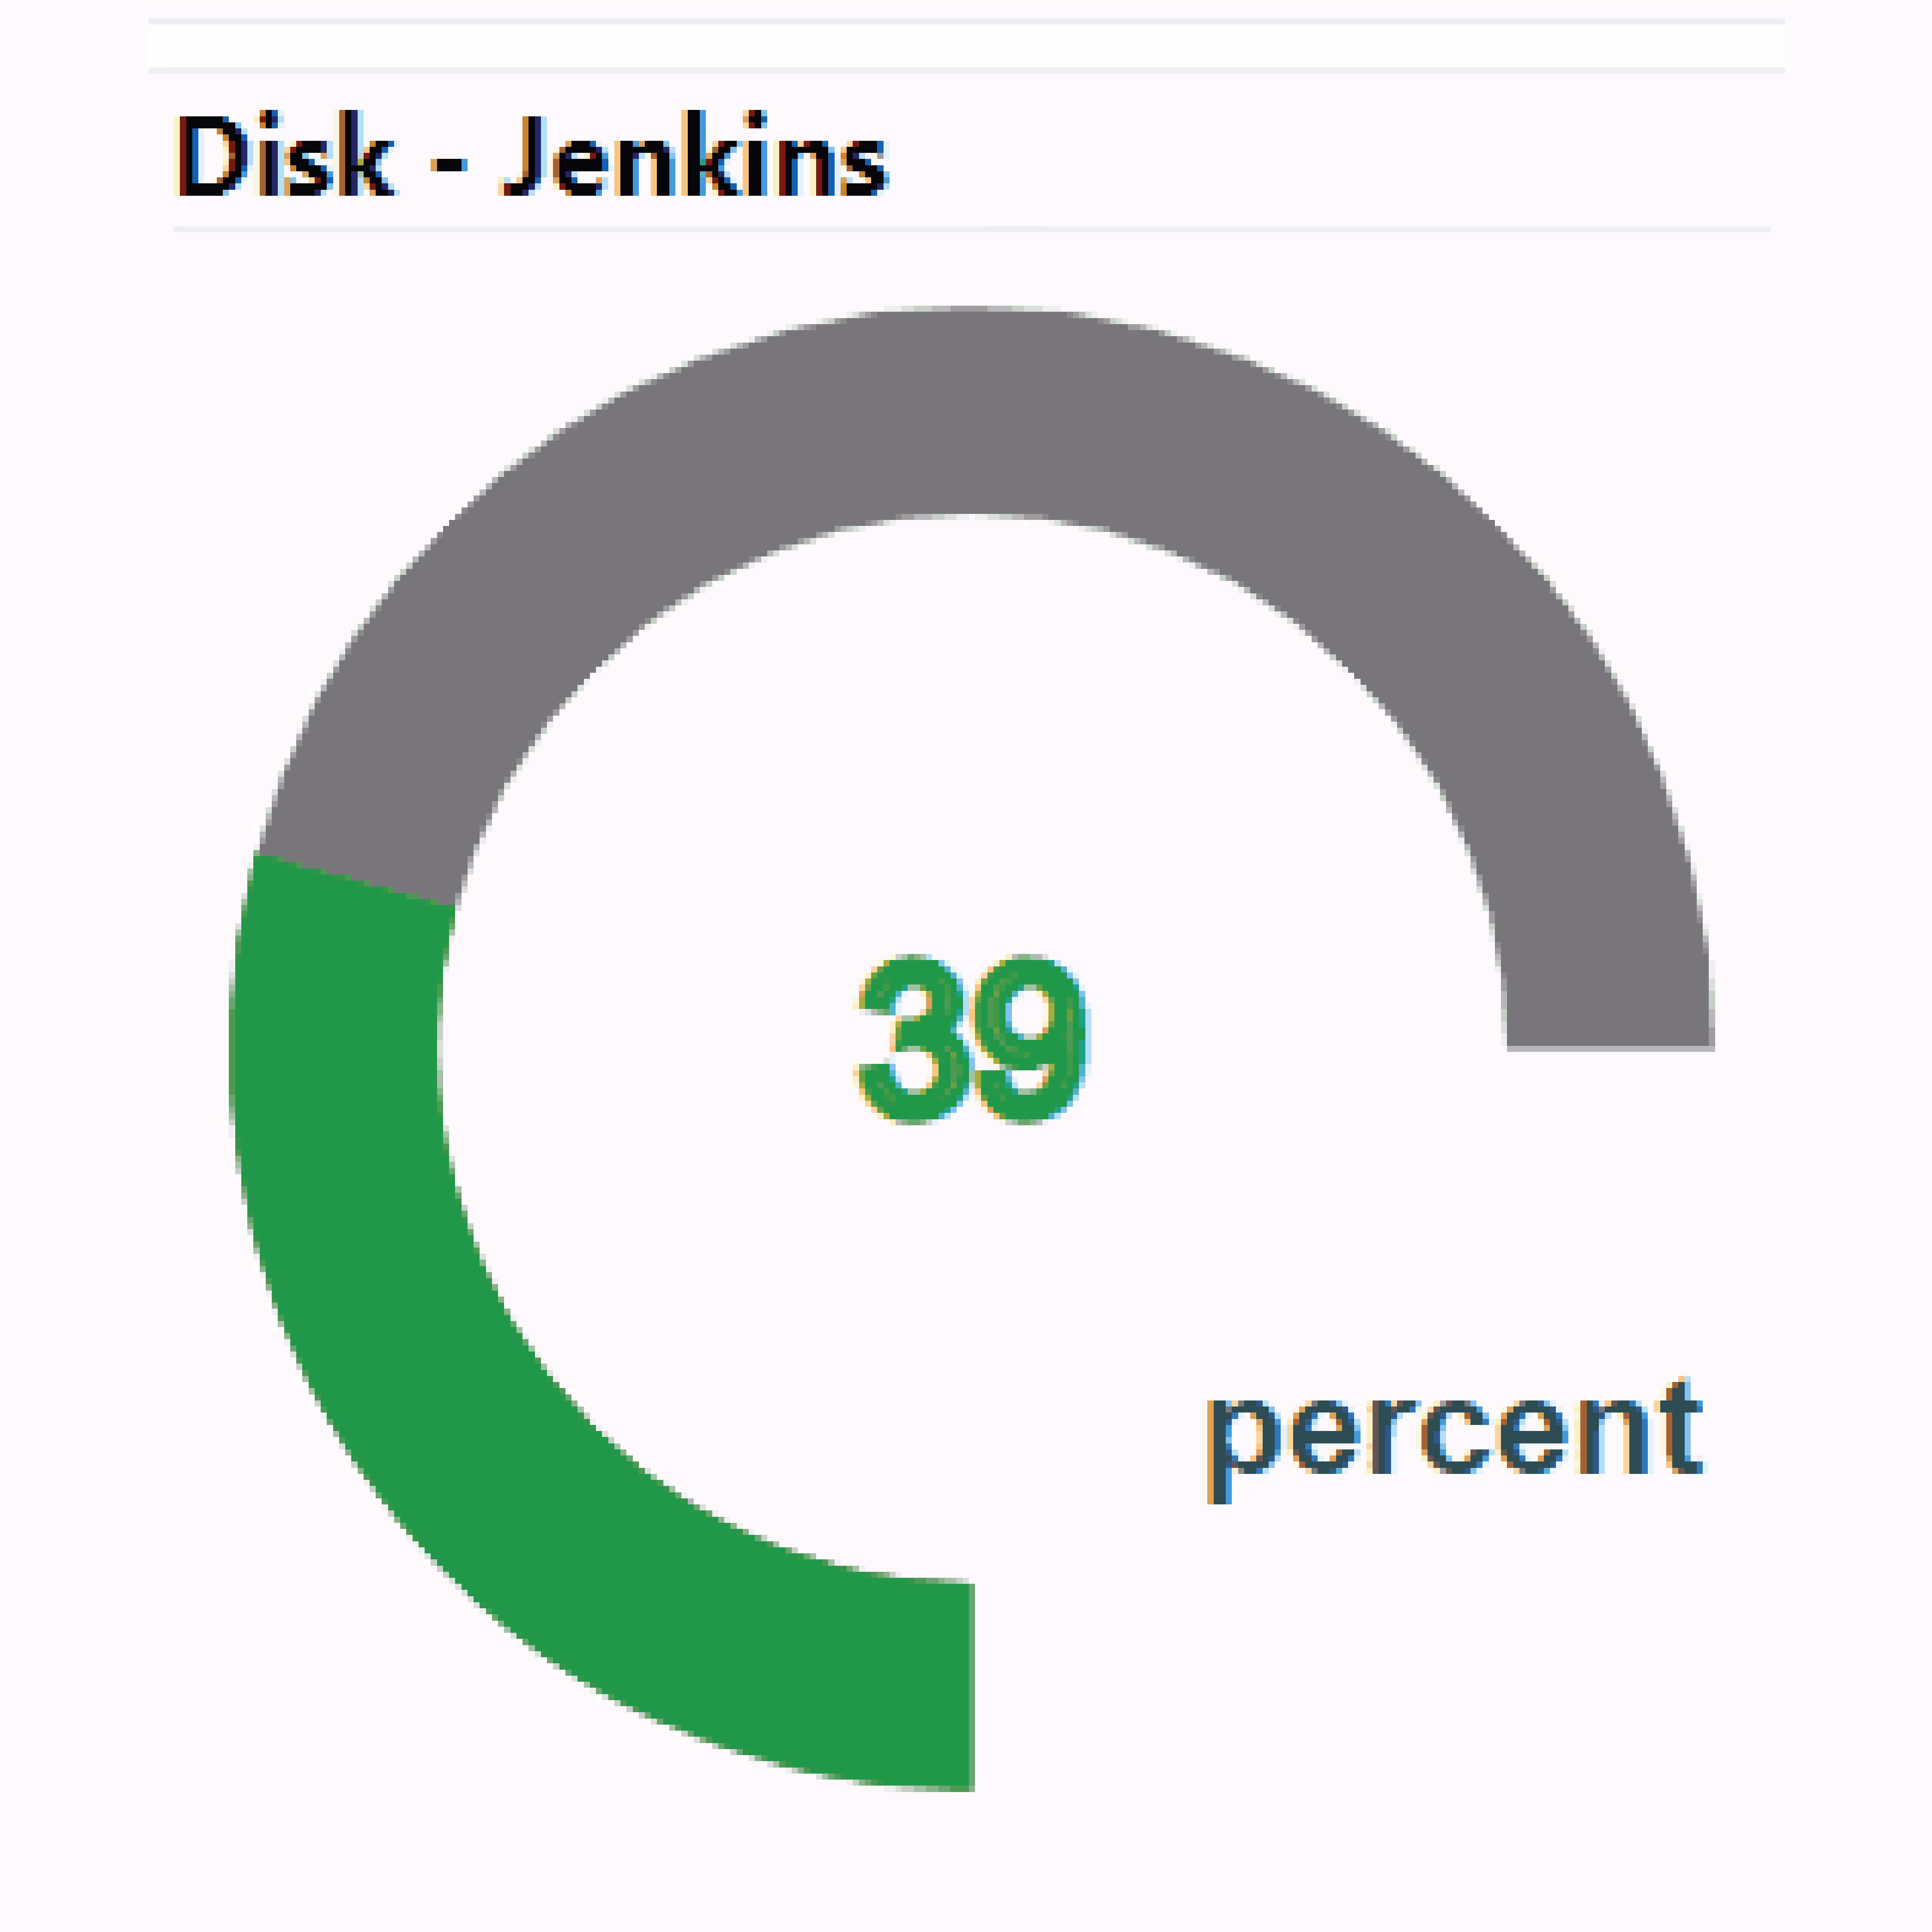
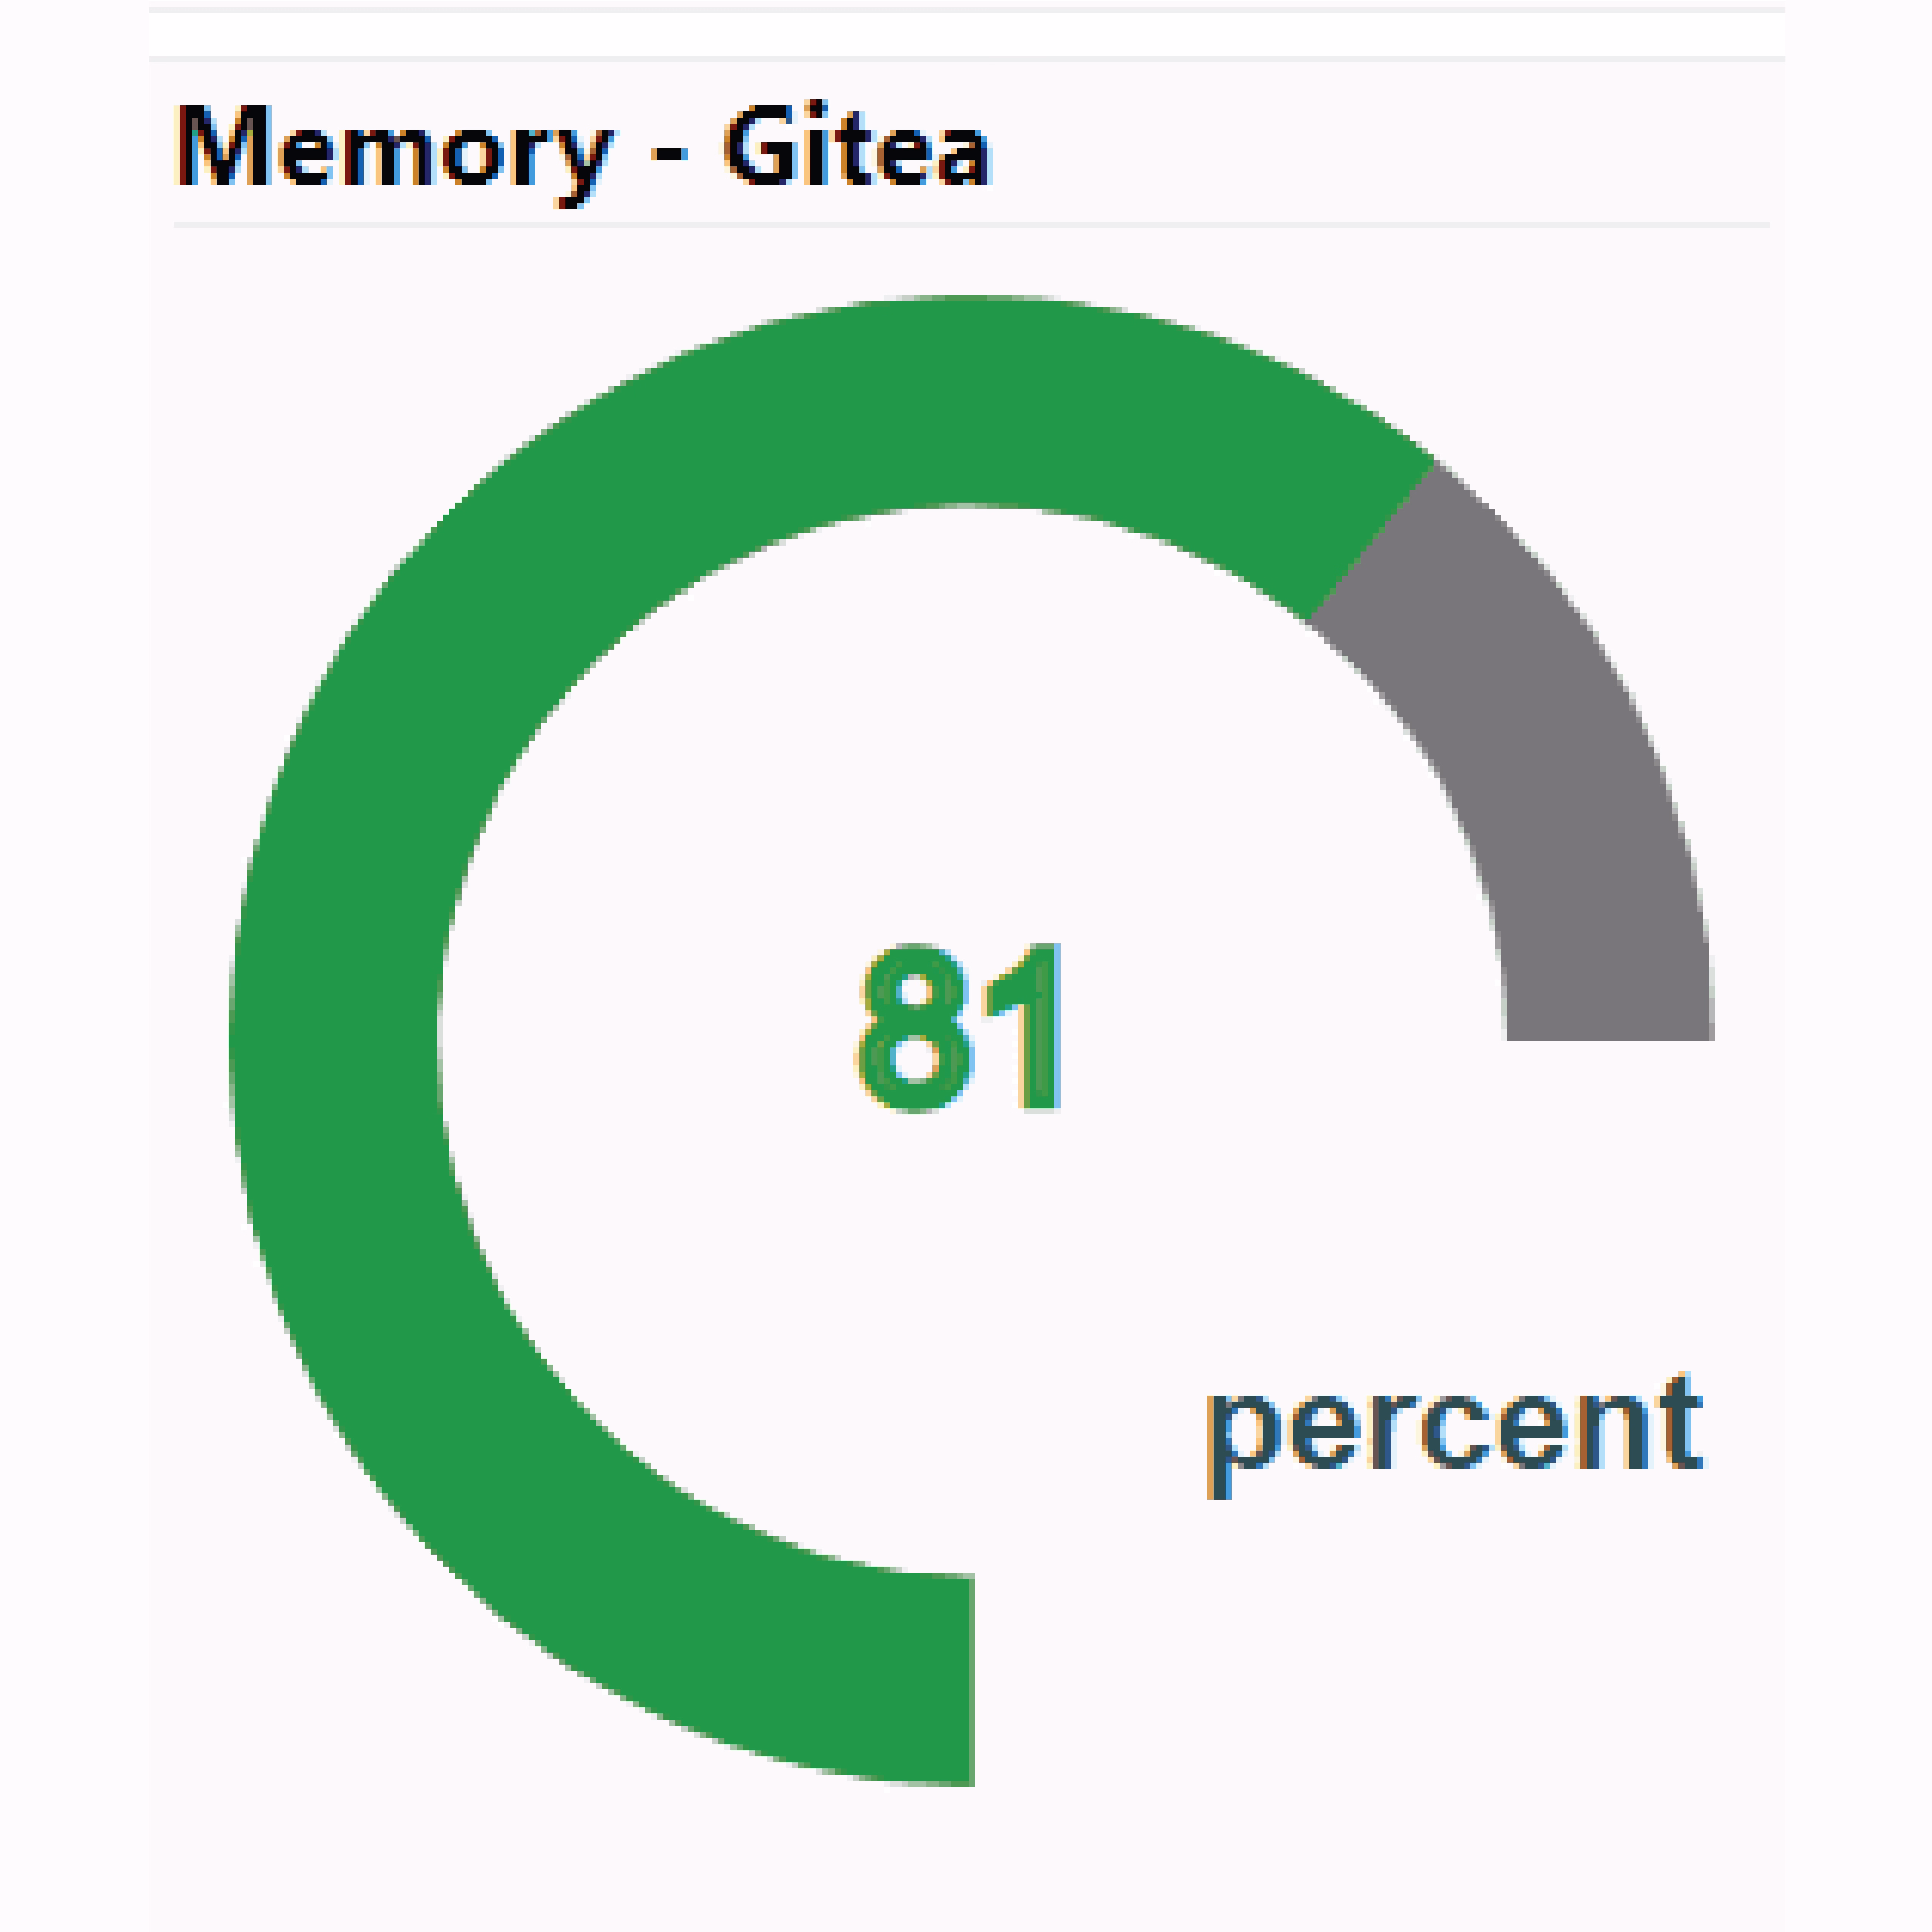
Gauge Views
Gauge views keep important values visible without taking over the dashboard. Stack multiple gauges together to monitor high-priority thresholds while preserving space for other operational context.
30 Day Free Trial
Understand, monitor, and control your network with ThirdEye, free for 30 days.