Incidents and Alarms
Show active monitoring incidents, unreachable nodes, trap-driven alerts, and updated status by device.

True progress is not driven by criticism or comparison, but by energy—energy that comes from shared values and purpose. Sustainable success is built on resources on disciplined effort, attention to detail, and responsibility for the quality of one’s work.
Consistently pursuing what is right rather than what is easy, our collective conscience becomes visible in what we create: products that endure, services that feel thoughtful, and organizations that earn trust. True progress does not come from shortcuts, but from patience, persistence, and pride in craft.
To move forward with confidence, it is as important to recognize our strengths as it is to examine our shortcomings. Knowing where our energy truly comes from—our values, standards, and care for others—restores our momentum and builds something lasting.
ThirdEye Dashboards
ThirdEye dashboards give network teams a live operations view that combines alerts, device health, compliance risk, recent changes, maps, service checks, and performance trends on one screen.
Create a NOC view, a site view, an application view, or a leadership summary. Each dashboard can focus on the context that matters for the people using it.
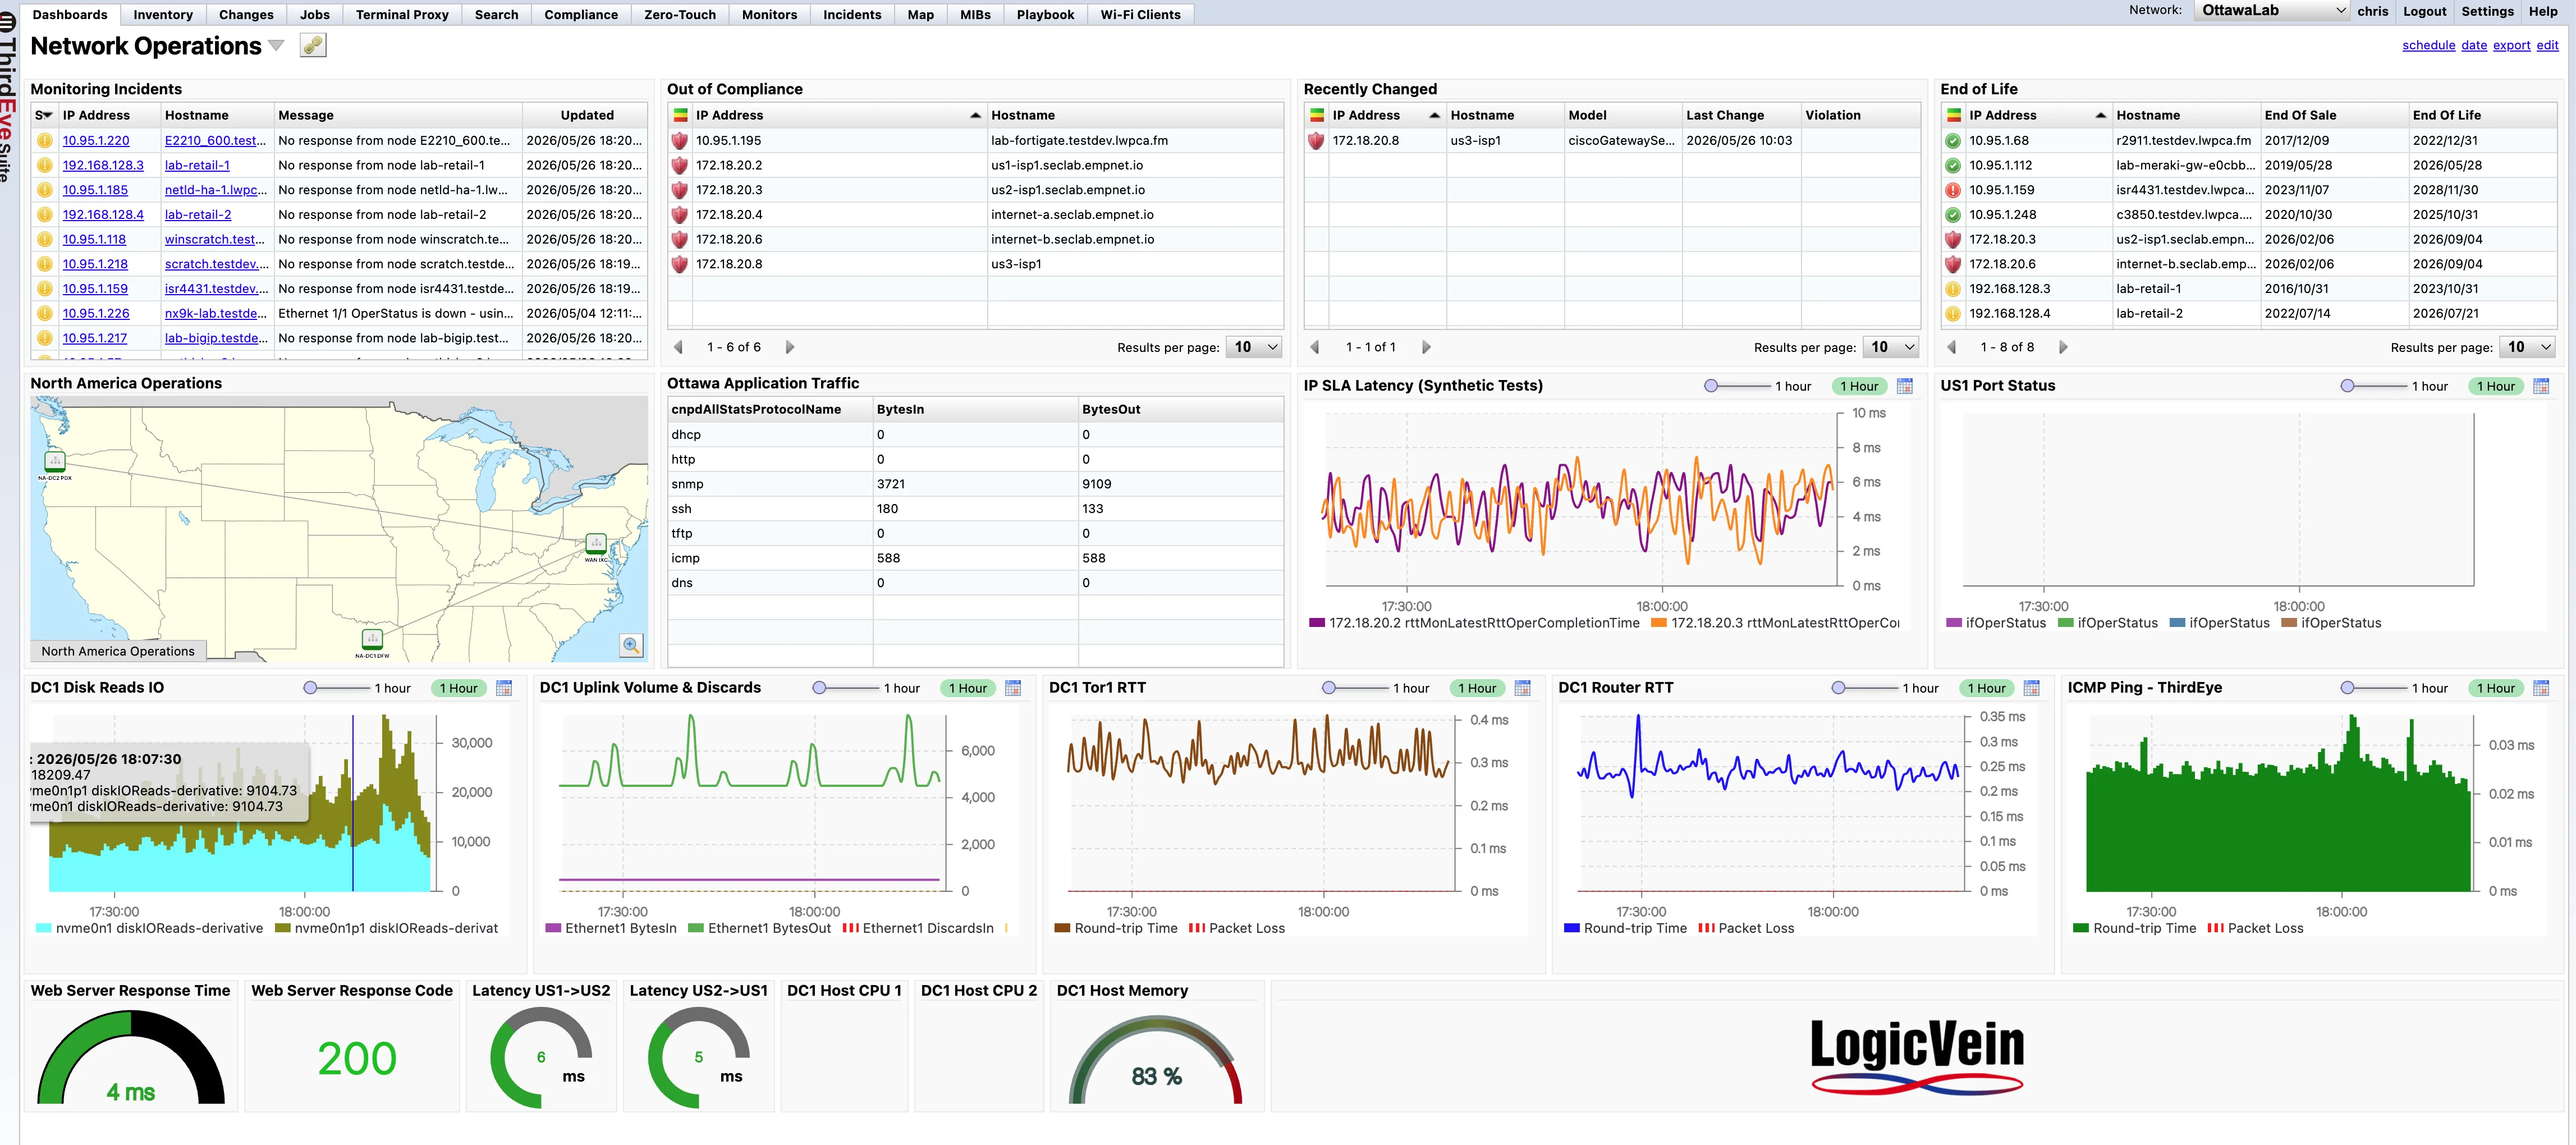
This example dashboard pulls together the context a network team needs during a shift: what is broken, what changed, which devices are risky, where the issue lives, and whether services are still responding.
 1
2
3
4
5
6
1
2
3
4
5
6
A useful operations dashboard brings together different kinds of evidence so engineers do not have to jump between screens to answer basic questions about health, risk, and recent activity.
Show active monitoring incidents, unreachable nodes, trap-driven alerts, and updated status by device.
Surface out-of-compliance devices, recent configuration changes, policy violations, and end-of-life exposure.
Use geographic or logical maps to show site reachability, location context, and regional operations status.
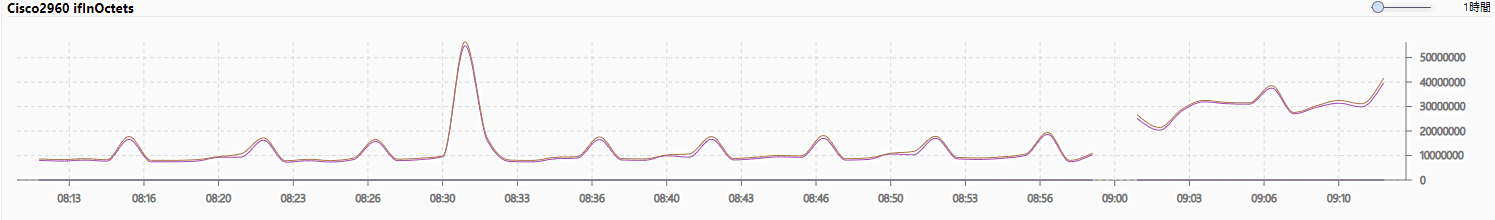
Track protocol traffic, interface volume, uplink discards, port status, and utilization patterns over time.
Display ICMP, IP SLA, round-trip time, packet loss, response time, and application checks.
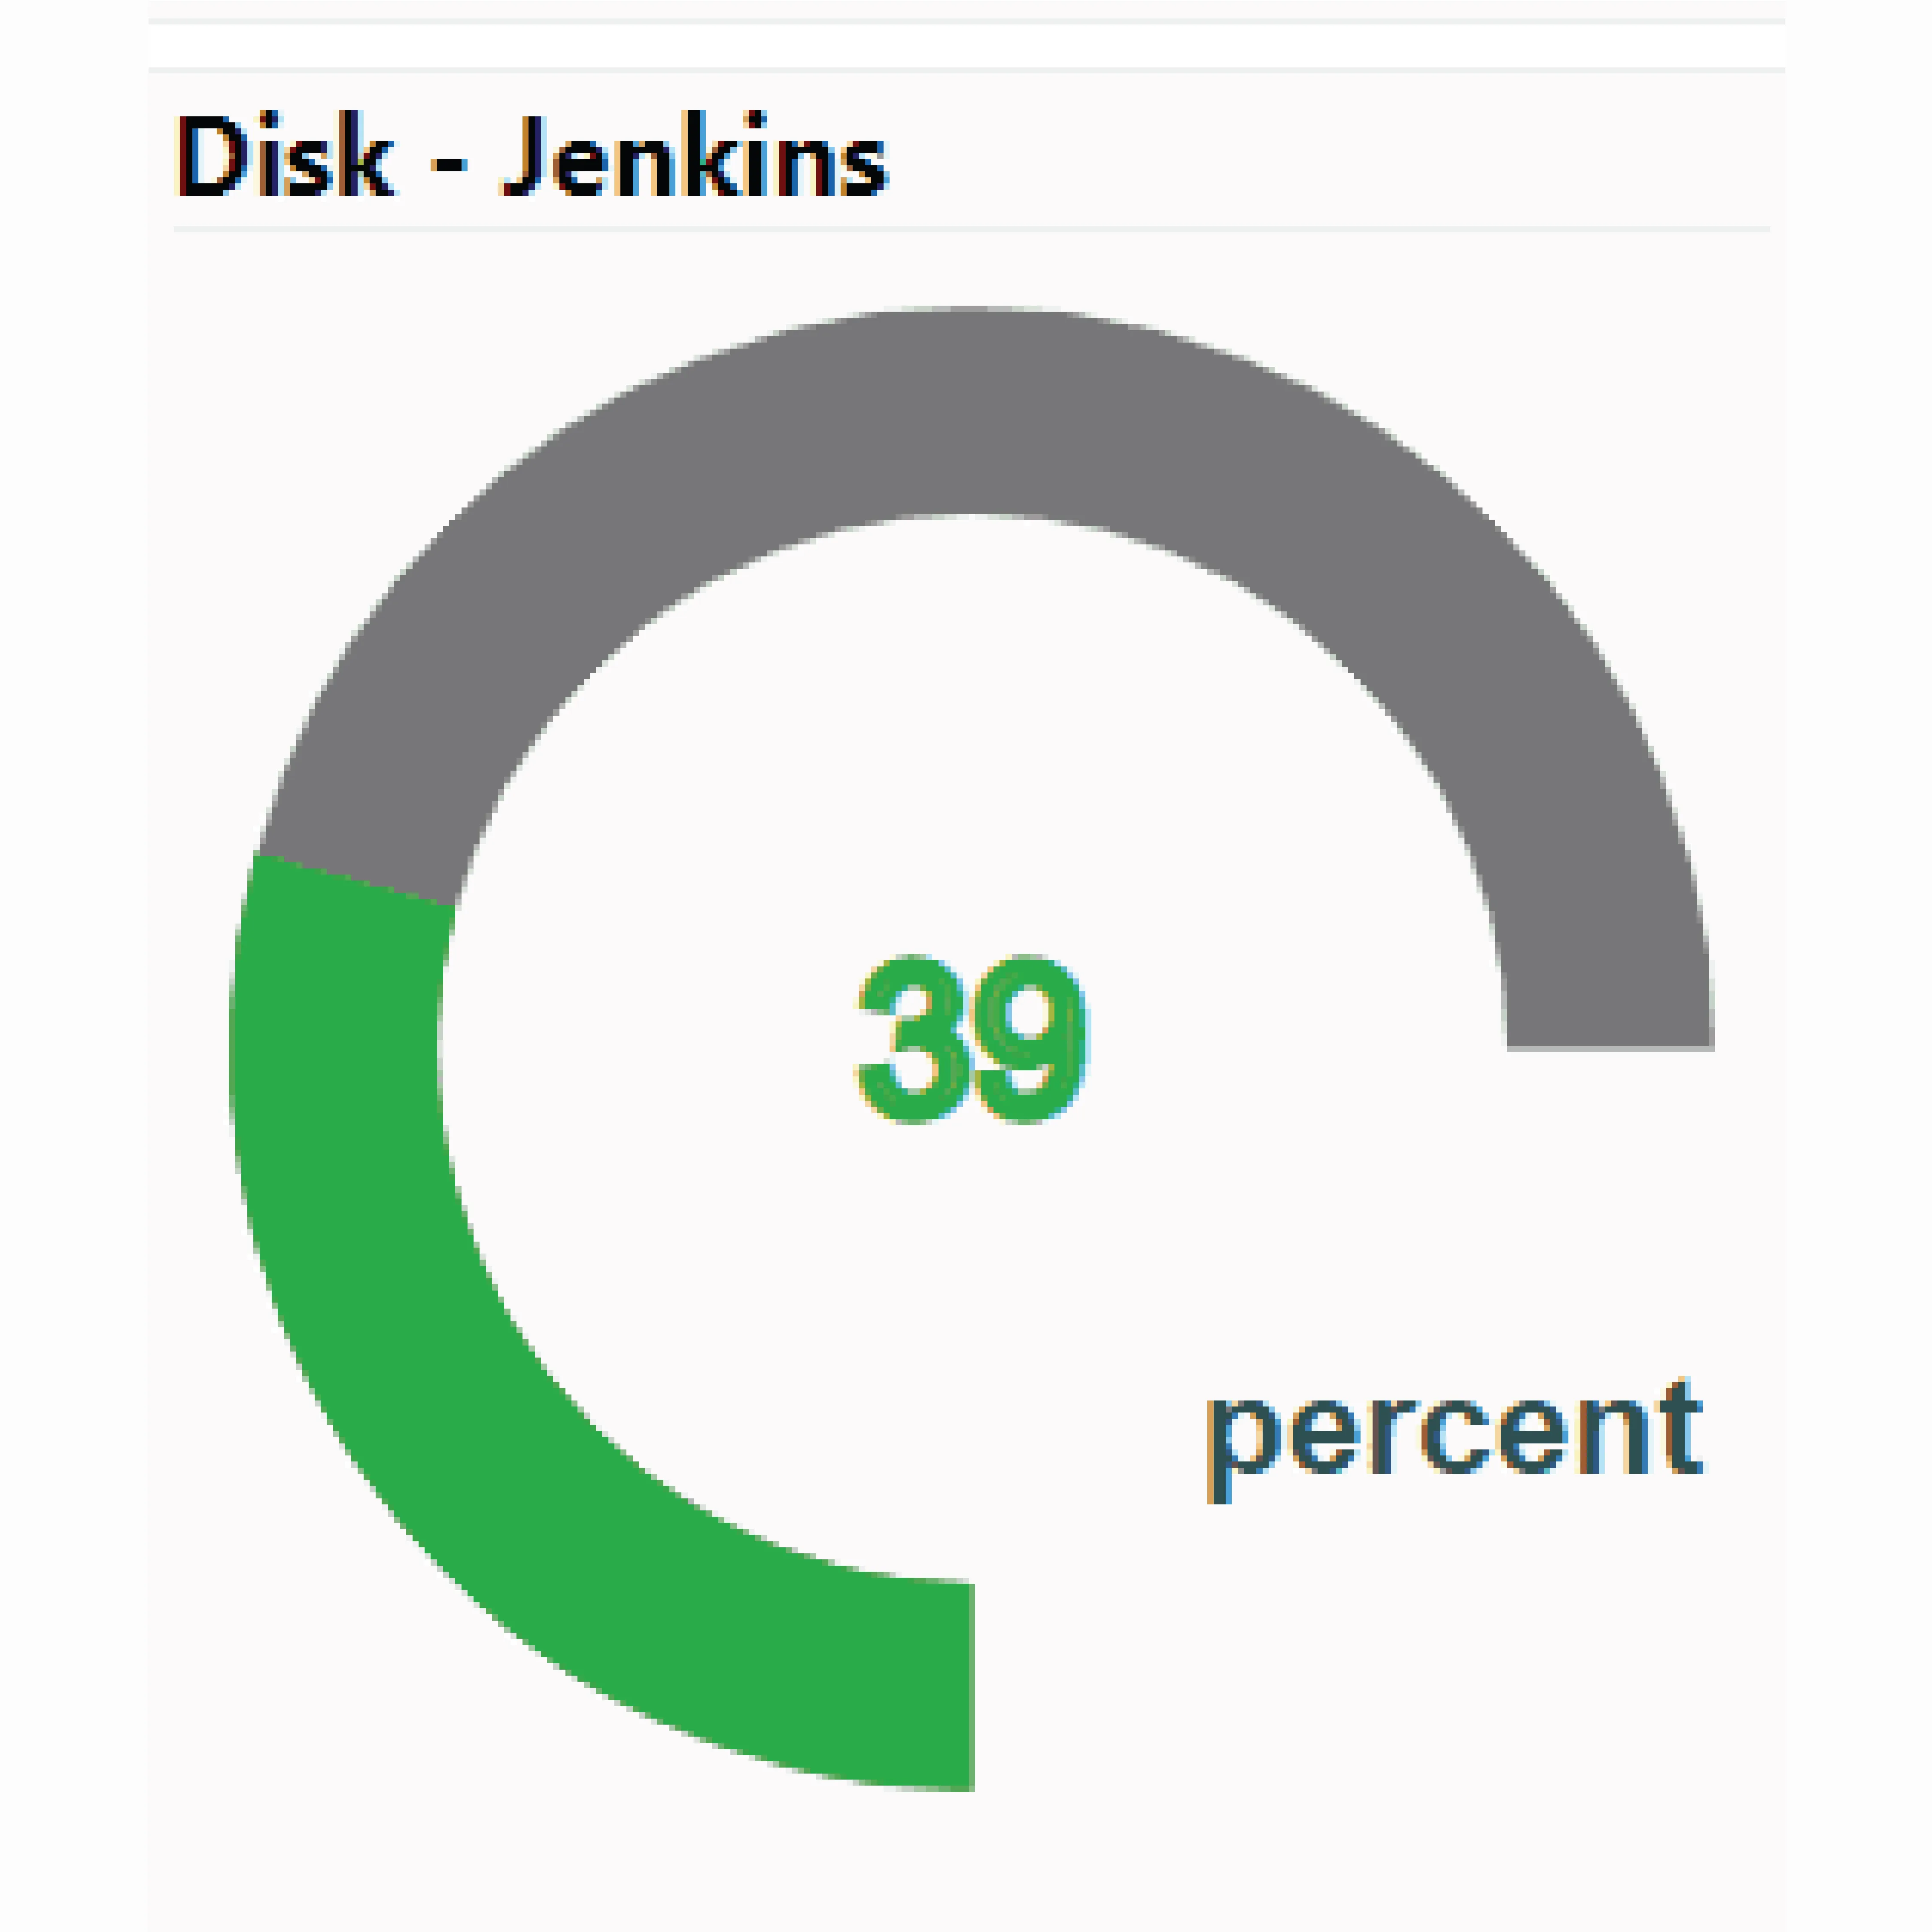
Monitor CPU, memory, disk, I/O, service response codes, and other operational counters in graphs or gauges.
When a network issue starts, teams need context fast. A dashboard can show whether the problem is isolated to a device, tied to a recent change, visible in latency, connected to a compliance violation, or part of a larger site event.
Nobody buys a platform just because it has dashboards. But when dashboards are missing, operators feel the gap immediately: more tool switching, more status calls, and more time spent building a picture that should already be visible. ThirdEye dashboards give teams a shared place to start.
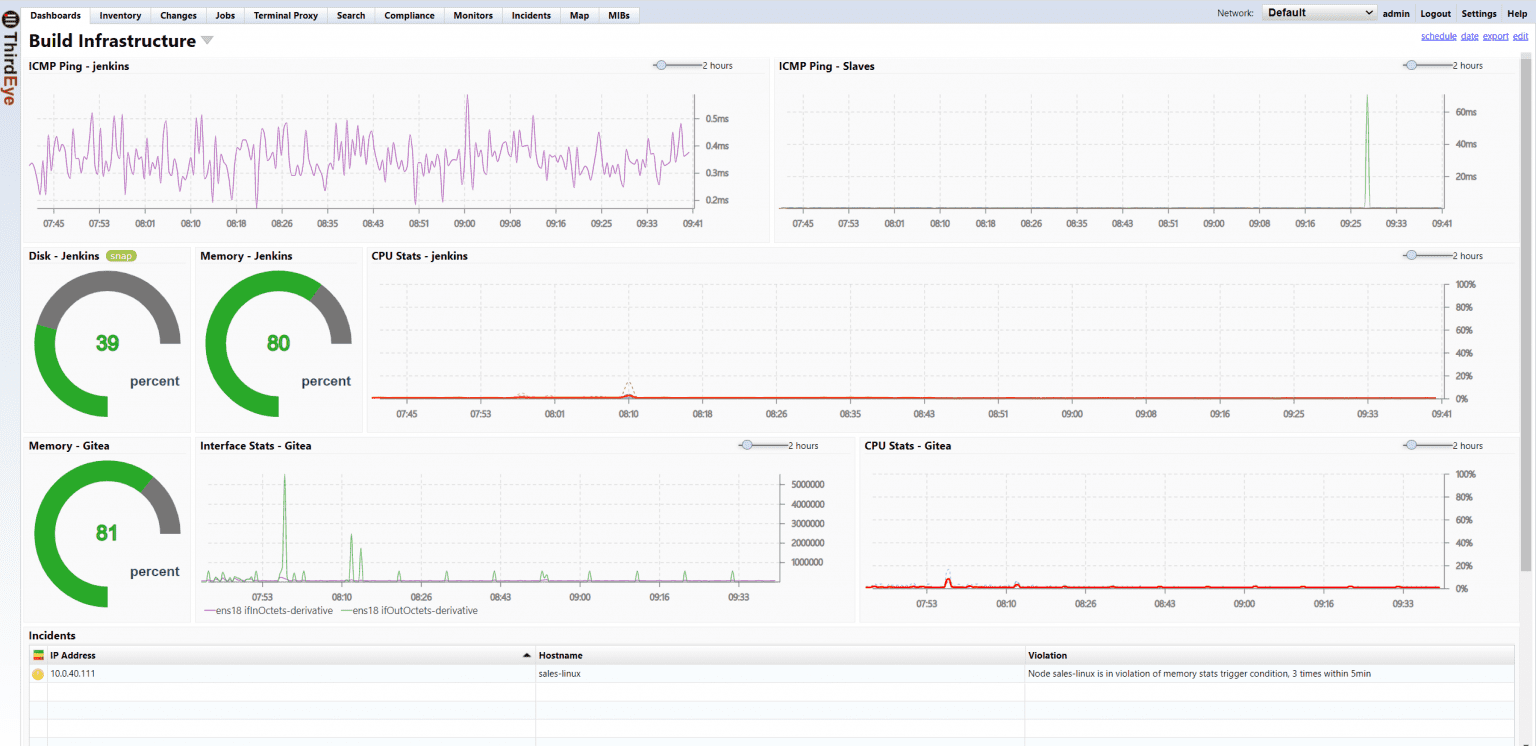
ThirdEye dashboards can mix tables, maps, graphs, and gauges so different kinds of operational context can sit next to each other. A NOC view might prioritize incidents and high-level health. A site view might focus on WAN latency, uplinks, and local device status. An application view might combine web response time, interface traffic, host CPU, and packet loss.
Understand, monitor, and control your network with ThirdEye, free for 30 days.