Agent-D
Server Monitoring for ThirdEye
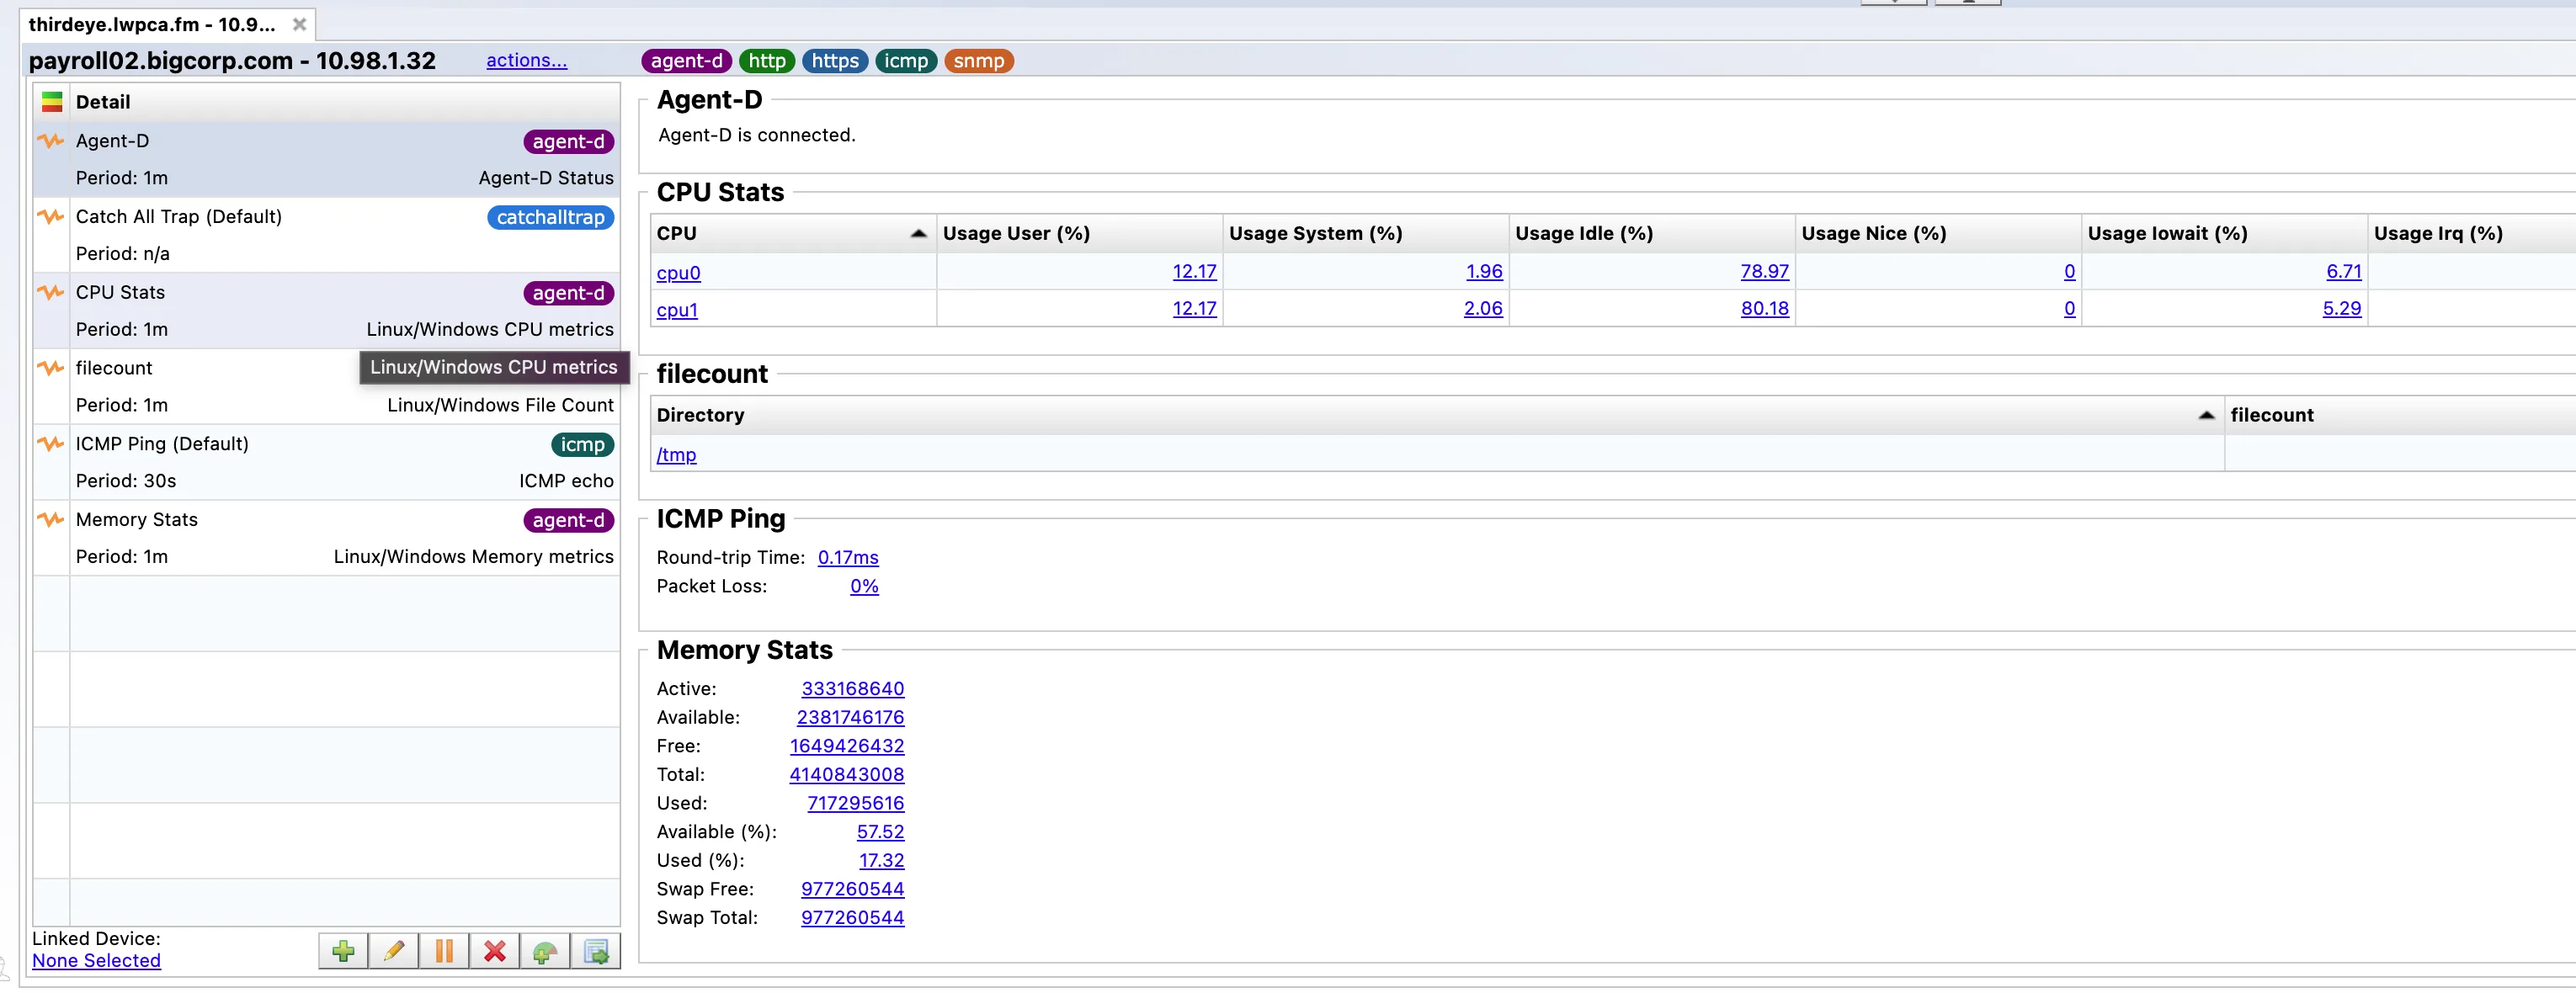
Agent-D extends ThirdEye visibility into Linux and Windows servers. It runs in the background, collects operating system metrics, and sends alerts or traps back into the same operational dashboard your team already uses for network monitoring.
Use it to monitor CPU, disk, memory, process, and syslog signals without separating server health from your network operations workflow.
Agent-D Capabilities
Agent-D brings host-level monitoring into ThirdEye so network and infrastructure teams can measure, trend, and alert on server conditions from a unified operating view.
-
 Server metrics
Monitor CPU utilization, disk capacity, memory availability, process status, and syslog activity from Linux and Windows servers.
-
 Alerts and traps
Configure polling intervals, output fields, monitored values, and trigger conditions so ThirdEye can alert when server health needs attention.
-
 Dashboards and trends
Display Agent-D results in ThirdEye dashboards, graph metric history over time, export collected data, or retrieve results through the ThirdEye API.
How Agent-D Works
Agent-D can be deployed from inside ThirdEye or downloaded and installed directly on the target server. After installation, teams apply monitoring templates from the ThirdEye template library and tune the collected fields, metrics, and alert behavior for each system.
Deploy the agent
Install Agent-D on Linux or Windows servers. In ThirdEye, operators can right-click a server and select Agent-D, or download the appropriate installer and run it on the host.
Apply monitoring templates
Choose the polling interval, output fields, monitored metrics, and alert or trap triggers that match your operational requirements.
Visualize and respond
Clicking a monitored value opens a graph for that metric, with configurable historical views ranging from one hour to two years. Teams can inspect server health without leaving the ThirdEye interface.
30 Day Free Trial
Understand, monitor, and control your network with ThirdEye, free for 30 days.